Published price A contractor price list shows white bulk salt at $120 a ton delivered to the KC area; treated at $139–$149 a tonFreeze-thaw Kansas City averages about 74 freeze-thaw days a year with only about 18 inches of snow (our count of NOAA data, 1991–2020)NOAA normal Kansas City averages about 18.2 inches of snow a seasonNOAA normal Springfield averages about 13.7 inches of snow a seasonState line Missouri studded-tire window: Nov 2–Mar 31. Kansas: Nov 1–Apr 1Est. treated salt Pre-treated bulk salt usually runs $20–$50 a ton over plain rock saltEst. salt brine Salt brine by the gallon: roughly $0.20–$0.40, before deliveryEst. bagged rock salt Pallet of 49 × 50 lb rock salt bags: roughly $240–$330Est. ice melt pallet Pallet of 49 × 50 lb blended ice melt: roughly $430–$600Rule of thumb Plain rock salt slows way down below about 15°F pavement temperatureFall pre-buy Lock in tons and pickup or delivery before the first storm, not during itPublished price A contractor price list shows white bulk salt at $120 a ton delivered to the KC area; treated at $139–$149 a tonFreeze-thaw Kansas City averages about 74 freeze-thaw days a year with only about 18 inches of snow (our count of NOAA data, 1991–2020)NOAA normal Kansas City averages about 18.2 inches of snow a seasonNOAA normal Springfield averages about 13.7 inches of snow a seasonState line Missouri studded-tire window: Nov 2–Mar 31. Kansas: Nov 1–Apr 1Est. treated salt Pre-treated bulk salt usually runs $20–$50 a ton over plain rock saltEst. salt brine Salt brine by the gallon: roughly $0.20–$0.40, before deliveryEst. bagged rock salt Pallet of 49 × 50 lb rock salt bags: roughly $240–$330Est. ice melt pallet Pallet of 49 × 50 lb blended ice melt: roughly $430–$600Rule of thumb Plain rock salt slows way down below about 15°F pavement temperatureFall pre-buy Lock in tons and pickup or delivery before the first storm, not during it

Price figures are estimates from public bids and published price lists, not quotes. Where these numbers come from

Home › Storm Center

Storm Center

Live radar, the official National Weather Service forecast and alerts for Missouri, and NOAA's winter outlook, all in one place. Watch the storm, then lock in your salt.

Get a wholesale quote

Missouri winter alerts

Loading active National Weather Service alerts…

7-day forecast

Local forecast

Loading the National Weather Service forecast…

Forecast data: National Weather Service (api.weather.gov), refreshed when you load the page. For official warnings, always check NWS Kansas City/Pleasant Hill and NWS Springfield.

Live radar

Radar

Still images load first to keep the page fast. Tap Play loop for the latest animated loop.
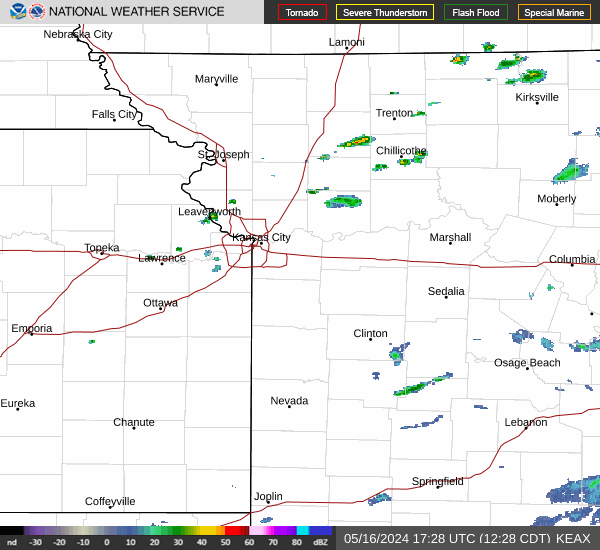
NWS radar, Kansas City/Pleasant Hill radar
Kansas City/Pleasant Hill radar. Source: NOAA / National Weather Service
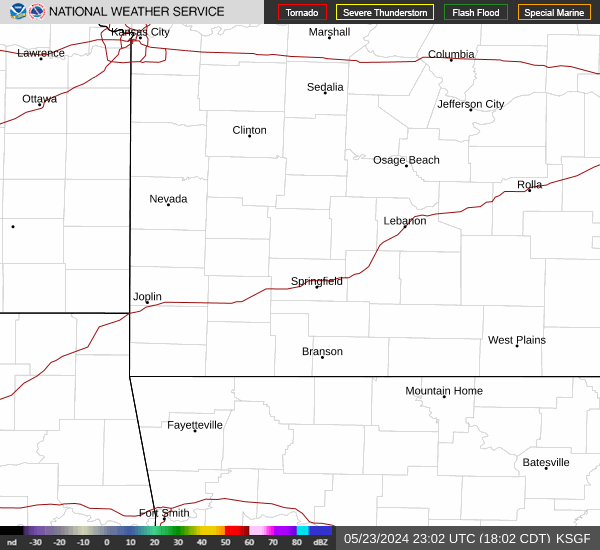
NWS radar, Springfield radar
Springfield radar. Source: NOAA / National Weather Service
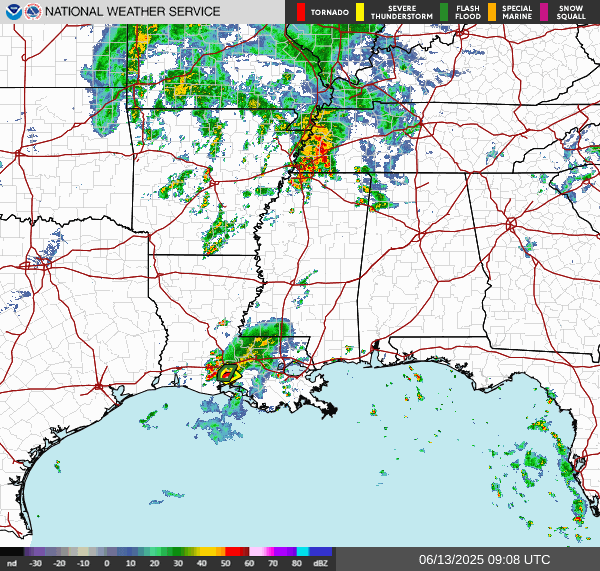
NWS radar, Lower Missouri/Mississippi Valley region
Lower Missouri/Mississippi Valley region. Source: NOAA / National Weather Service
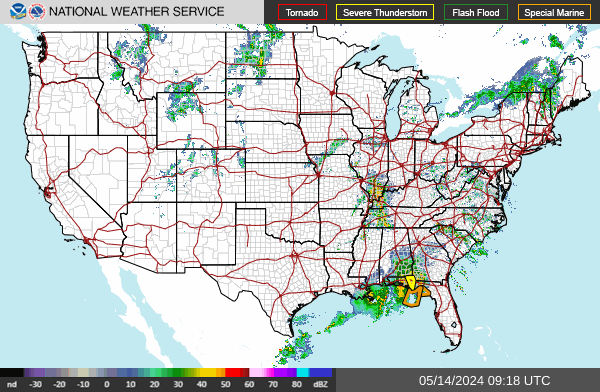
NWS radar, National
National. Source: NOAA / National Weather Service
Storm coming?

Lock in your salt before it hits

Tell us how many tons, where and when. Bulk delivery and storm-night loading keep you working when everyone else is scrambling.
  • Fast delivery, so you don't need a salt barn
  • Storm-night loading when a big event hits
  • Get on the storm-priority list for resupply
Urgent salt request

How much, where, and when?

When do you need it?

No obligation. Availability and pricing are confirmed on your quote. Planning a whole season instead?

NOAA Climate Prediction Center

Winter outlook, December–February

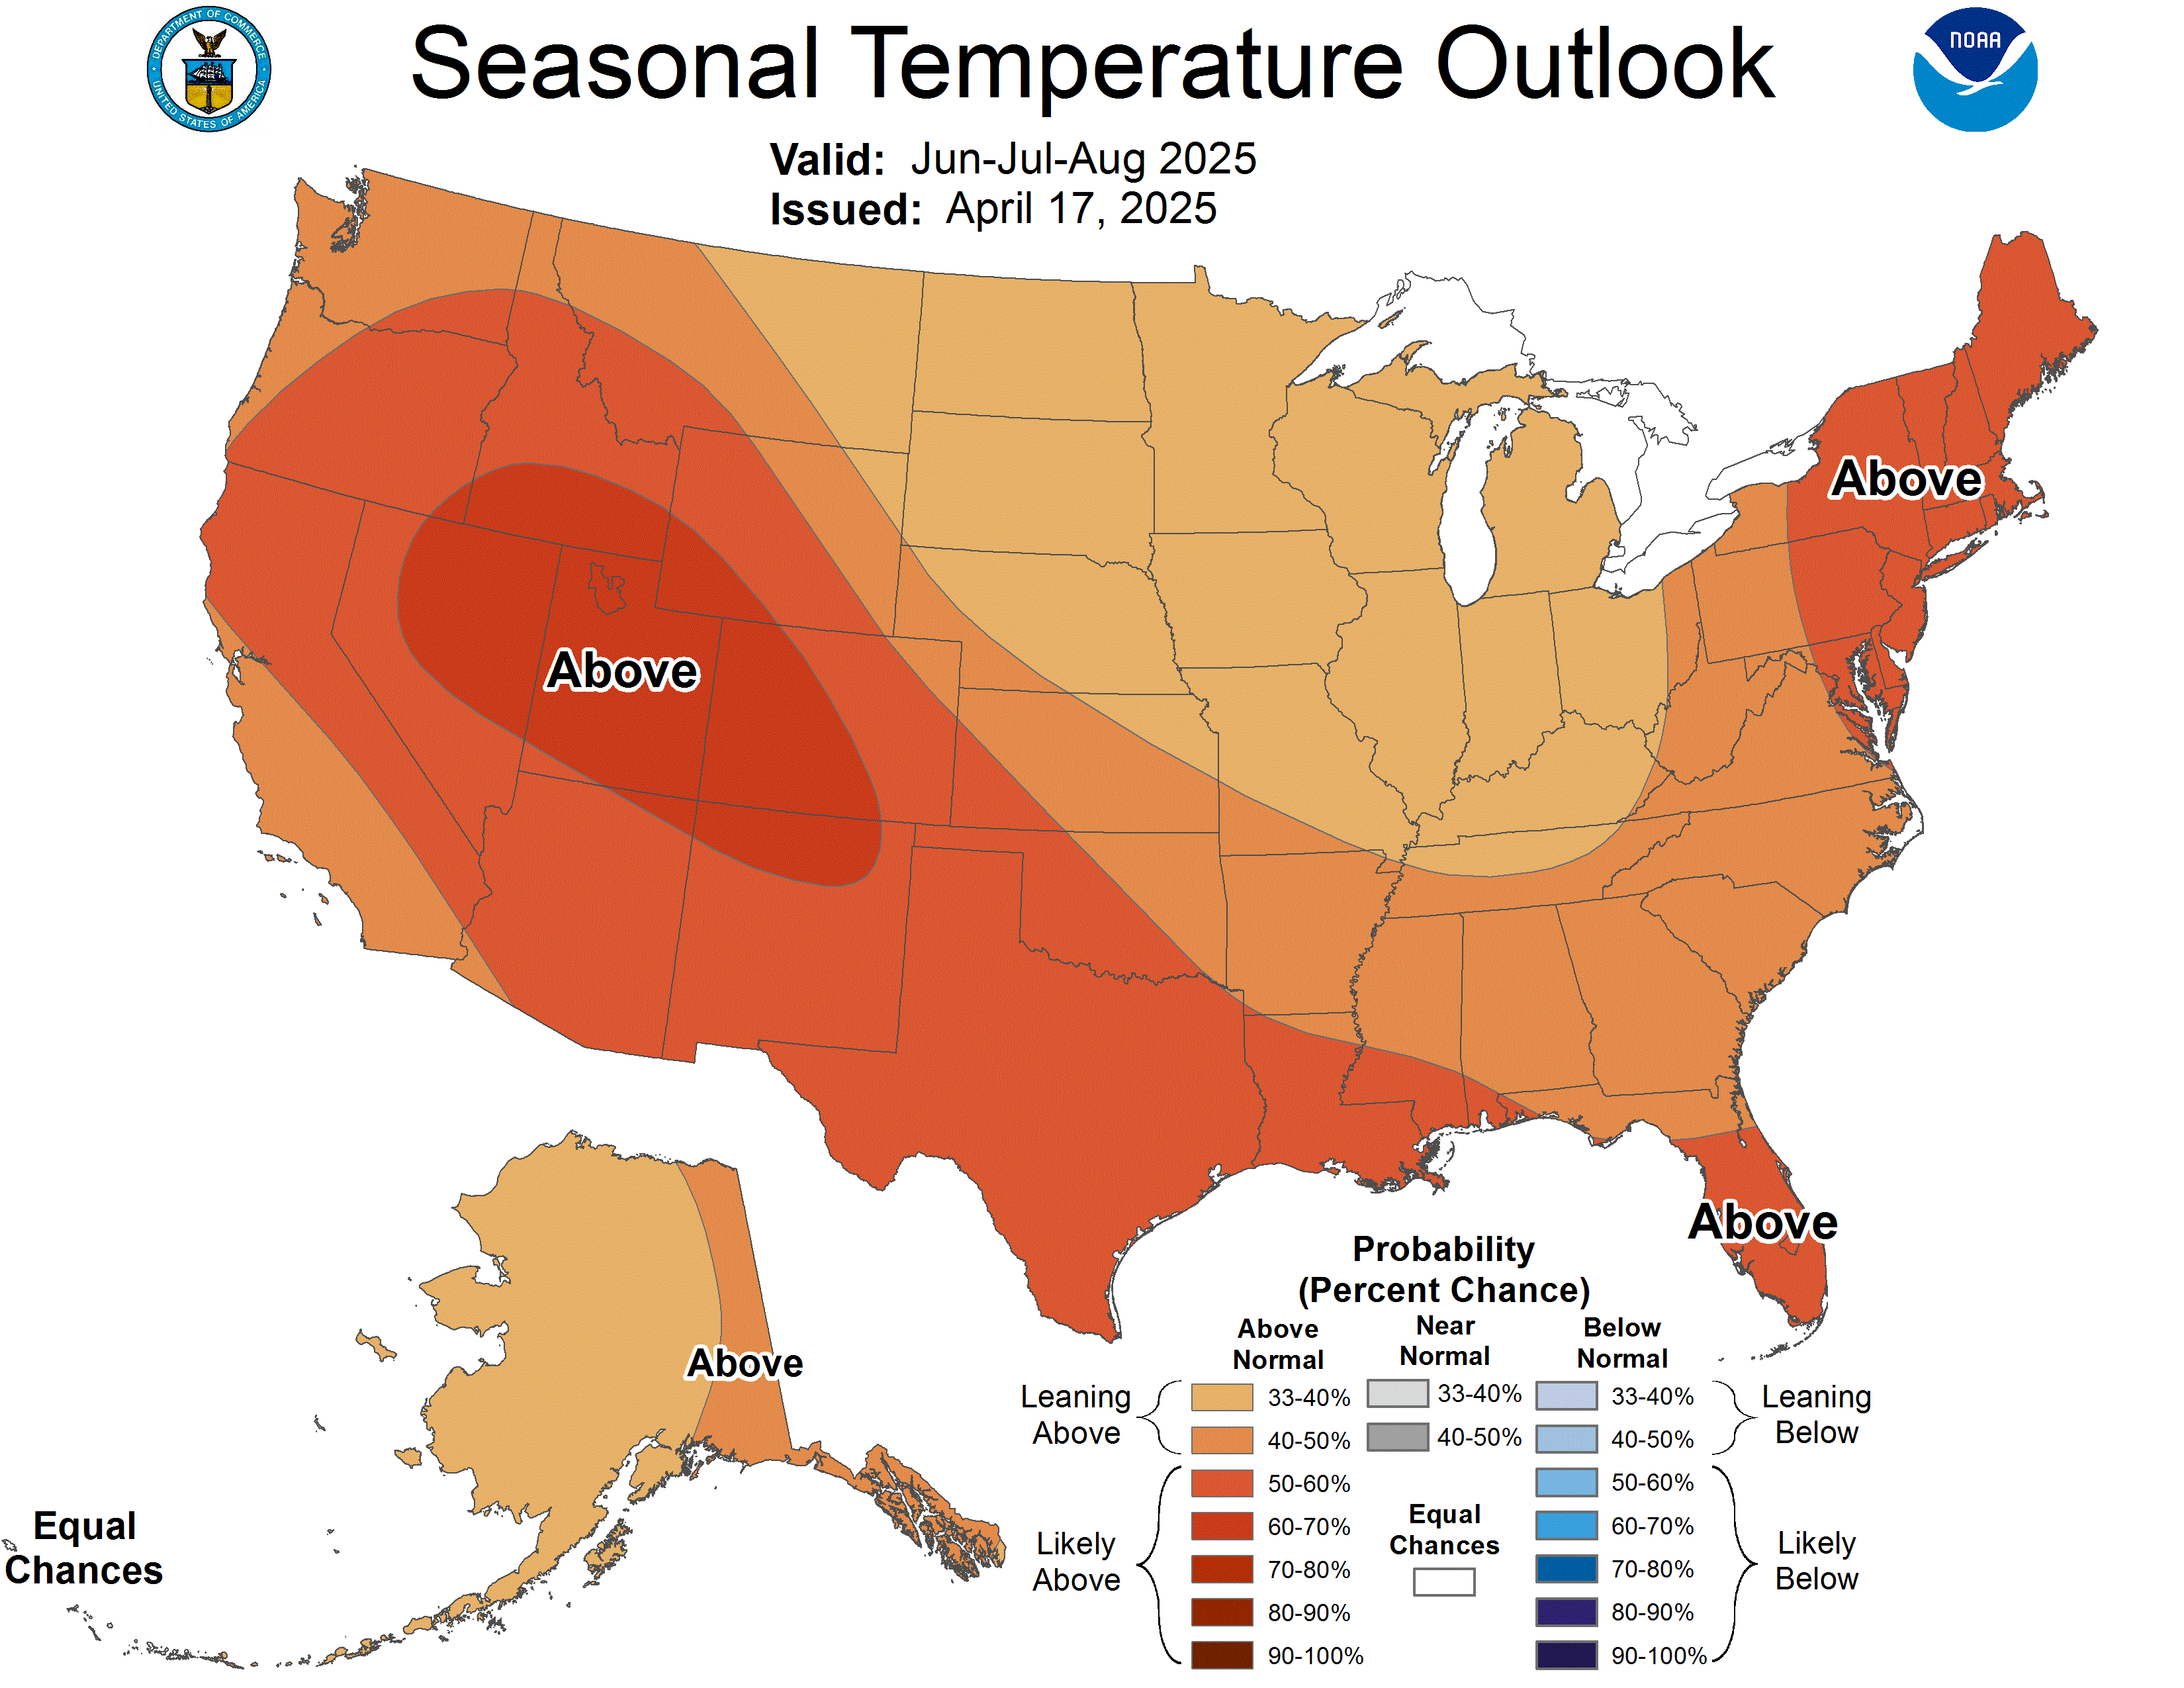
NOAA CPC seasonal temperature outlook for December through February
Temperature outlook. Source: NOAA CPC (live image, updated monthly).
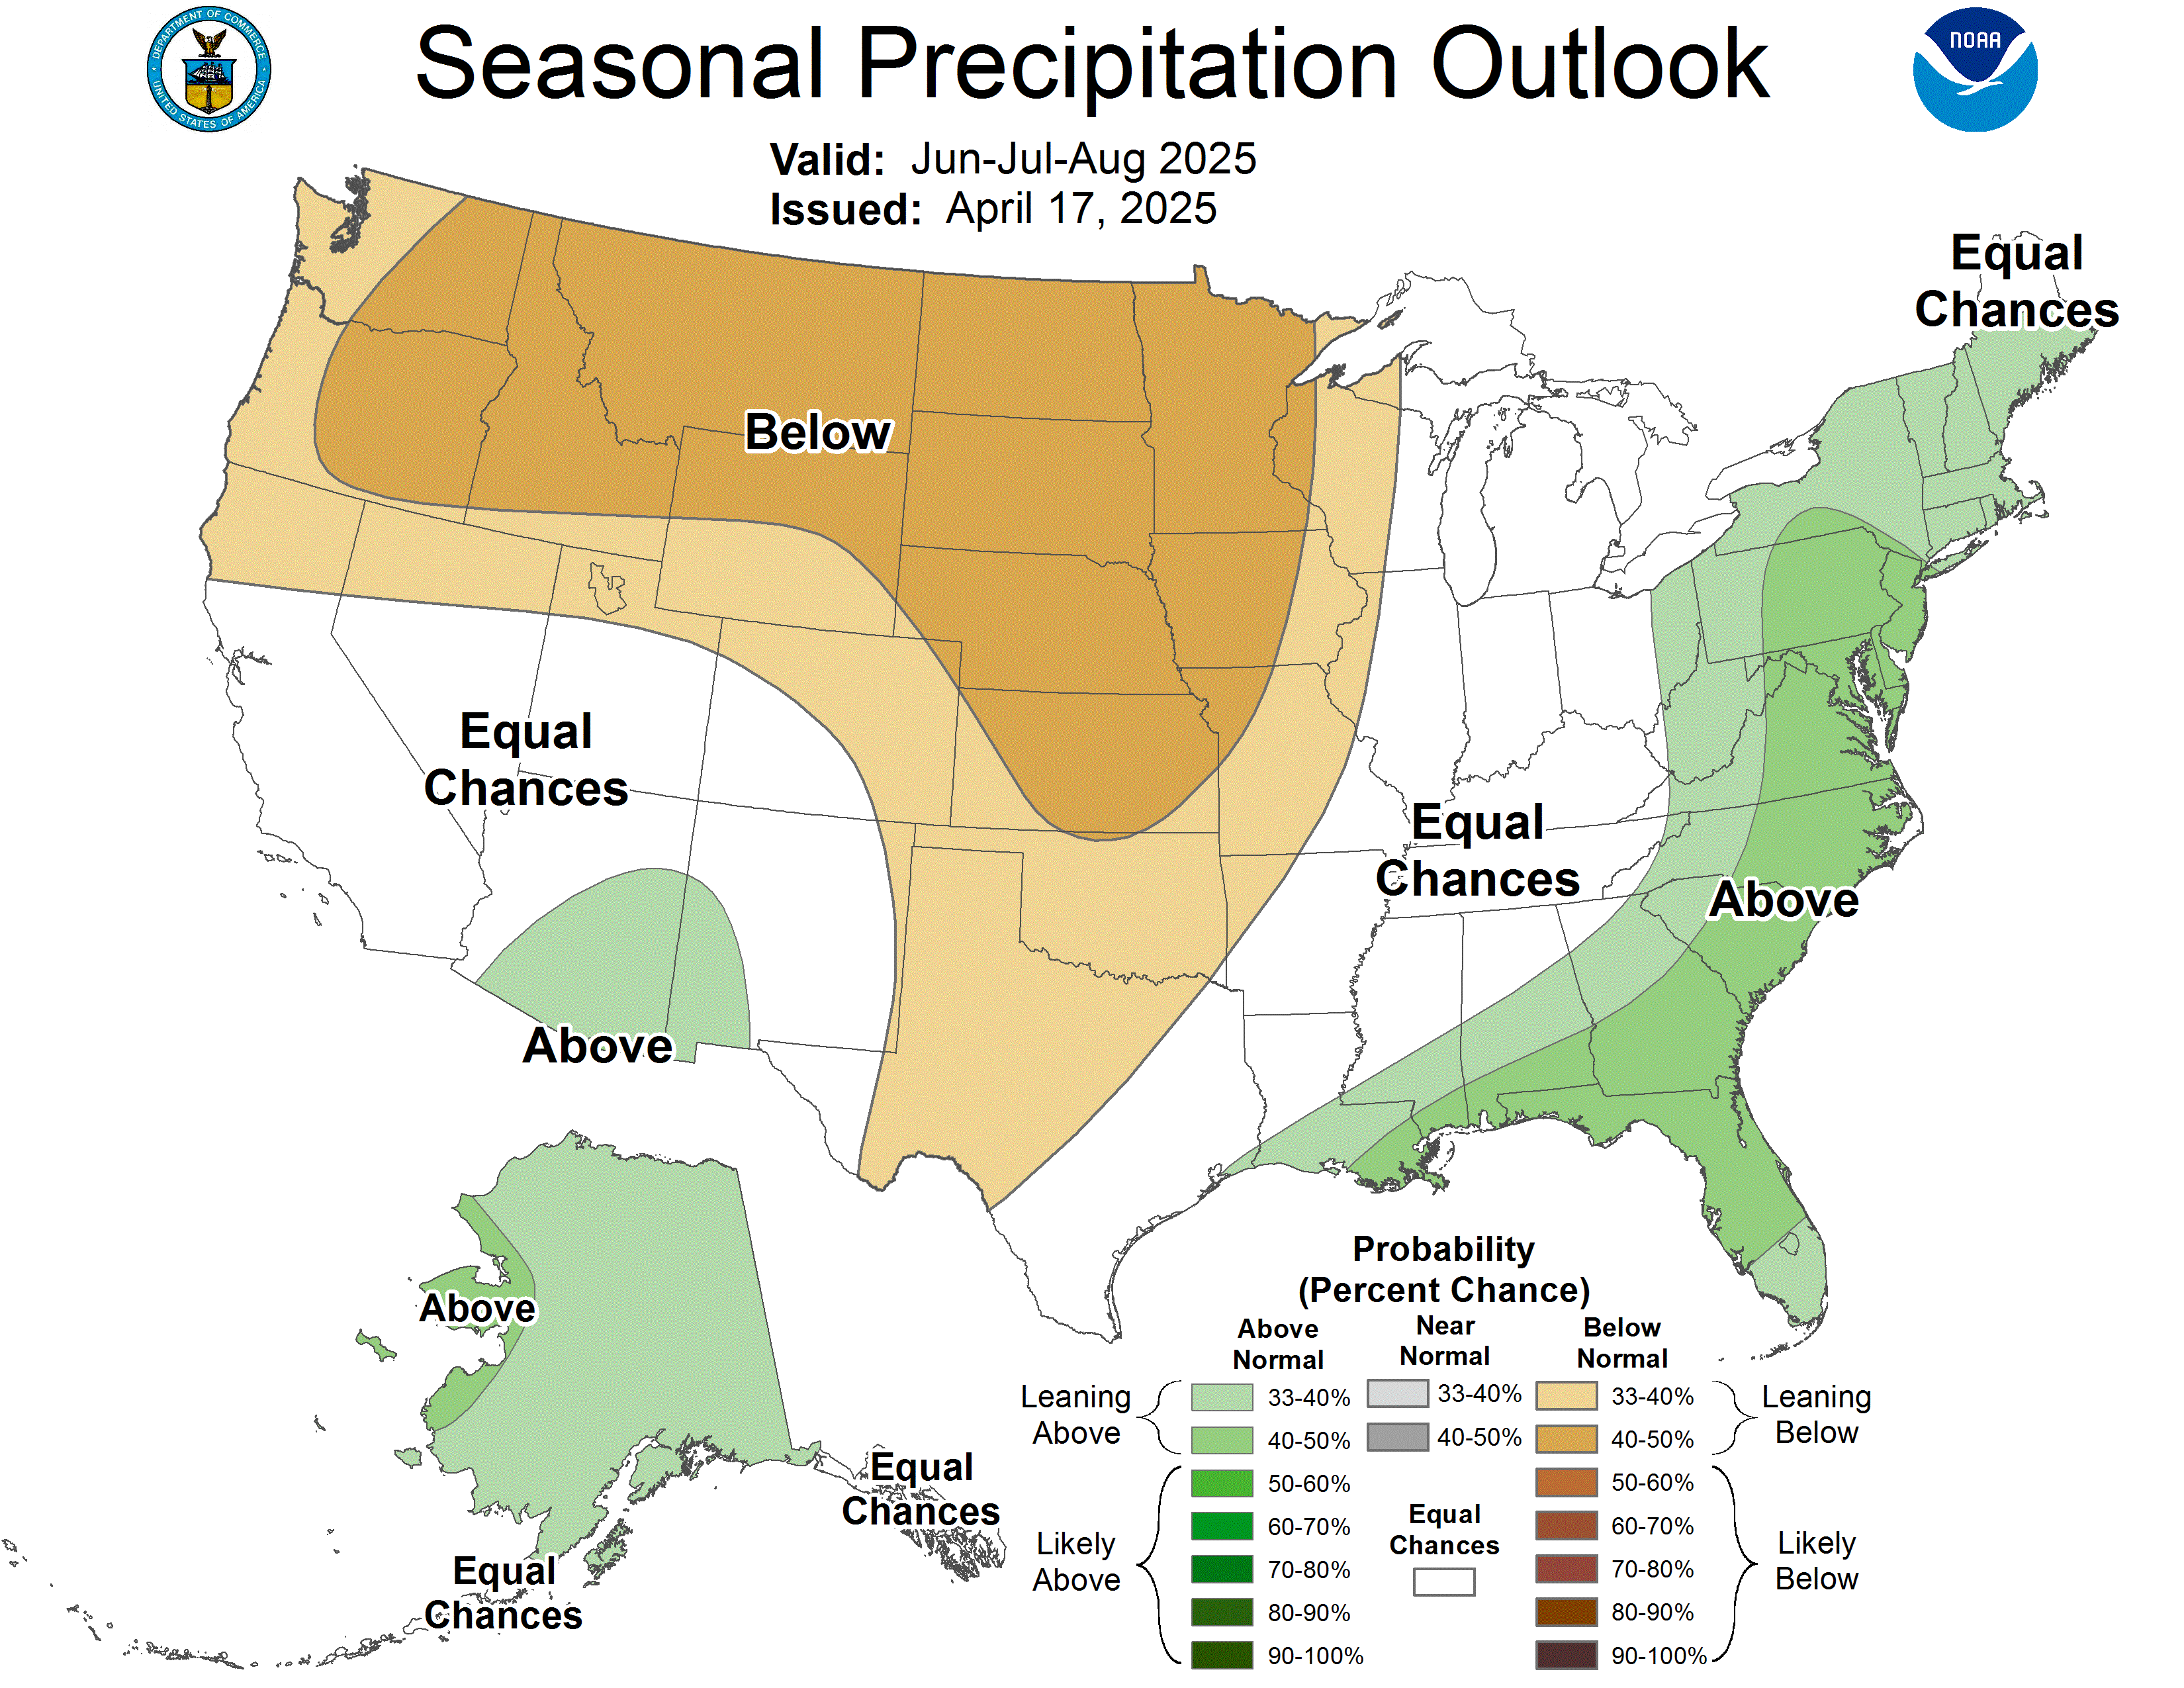
NOAA CPC seasonal precipitation outlook for December through February
Precipitation outlook. Source: NOAA CPC (live image, updated monthly).
In plain English (NOAA CPC outlook issued October 15, 2026, for Dec 2026–Feb 2027): NOAA's maps lean toward above-normal temperatures for Missouri this winter (about 33–50%, with the stronger lean in the north and east). For precipitation, the Kansas City side leans slightly wetter (about 33–40%), while eastern Missouri shows equal chances. A warm-leaning, wet-leaning winter near the freezing line can mean more ice, not less. These are probabilities, not a forecast of any storm. The maps above update automatically when NOAA issues a new outlook (third Thursday of each month), so this summary may lag behind them.

Official outlooks: NOAA CPC seasonal outlooks. We don't make our own predictions.

Share this page TextFacebook XLinkedIn Email
Get a wholesale quote